Technical Analysis: The Key to Crypto Trading Success
Imagine trying to navigate a ship through stormy seas without a map or compass. That's what trading crypto without technical analysis (TA) feels like. TA is your toolkit for reading the market's signals, helping you make smarter decisions in a world where prices can swing wildly in minutes.
Why Technical Analysis Matters
Crypto markets are open 24/7, and their volatility is legendary. Emotions run high, and it's easy to get swept up in the excitement or fear. Technical analysis gives you a way to cut through the noise and focus on what the market is actually telling you. It's not about predicting the future with certainty, but about stacking the odds in your favor.
Getting Started: Reading the Charts
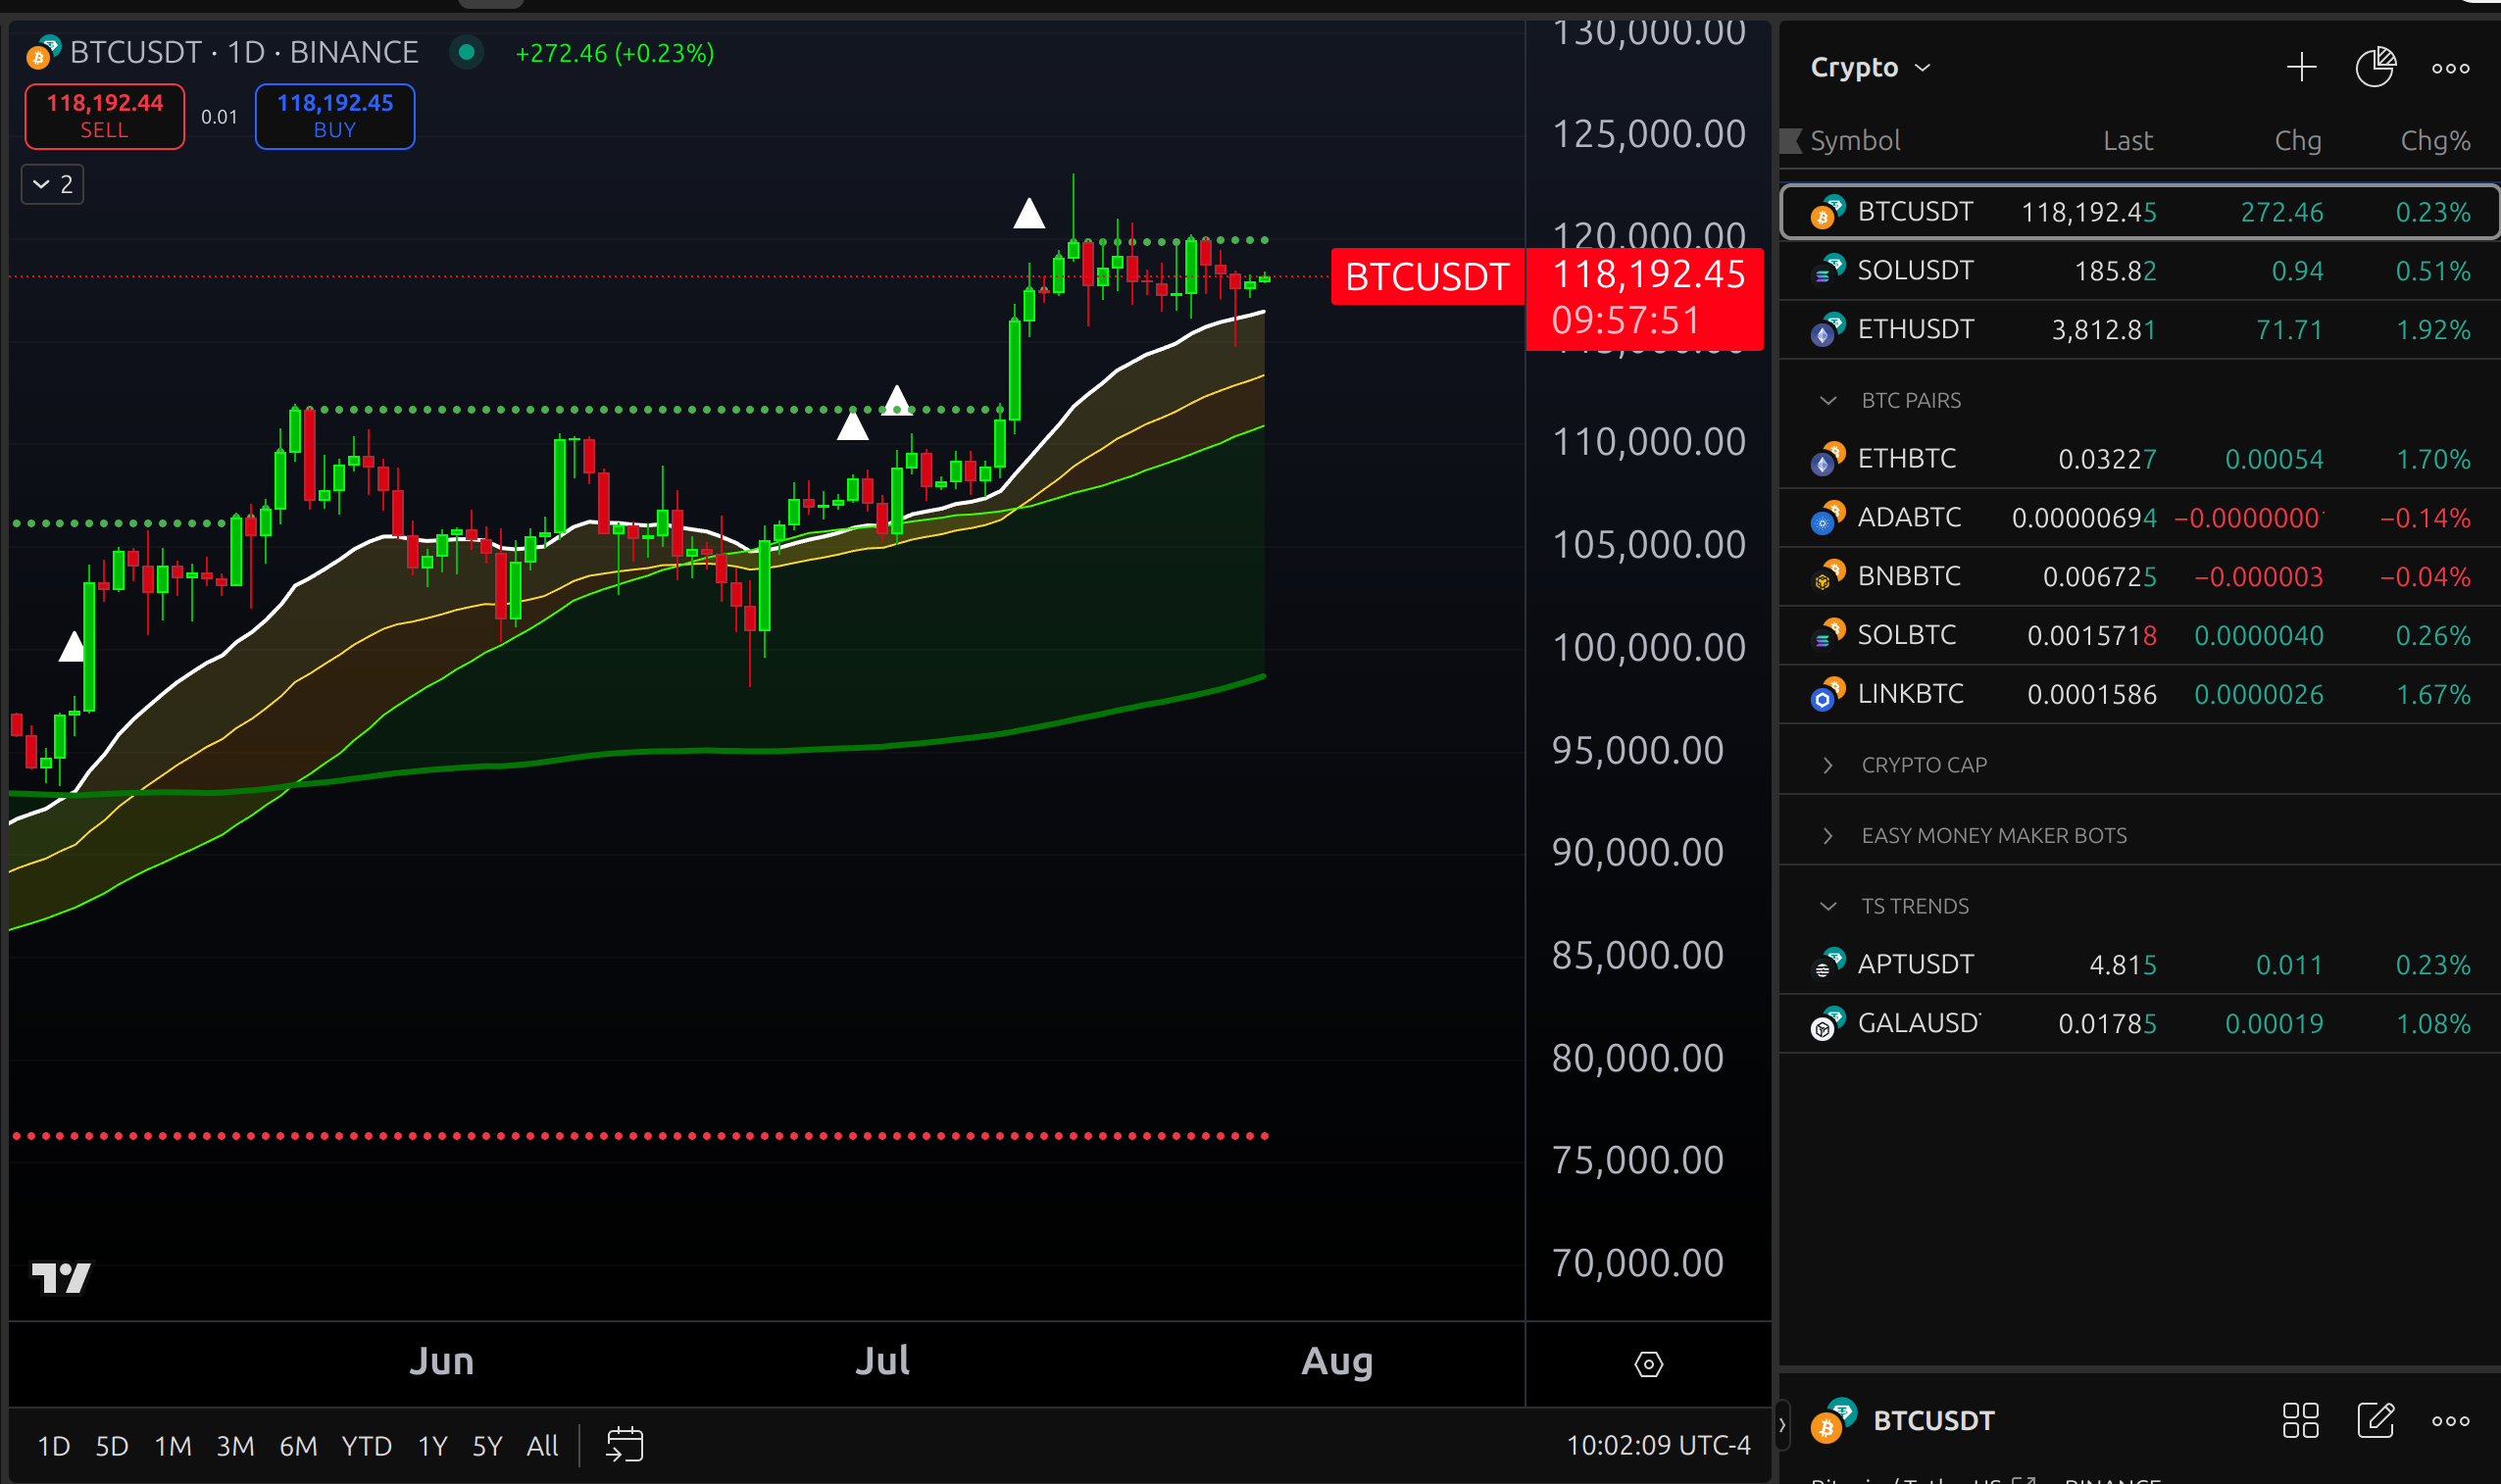
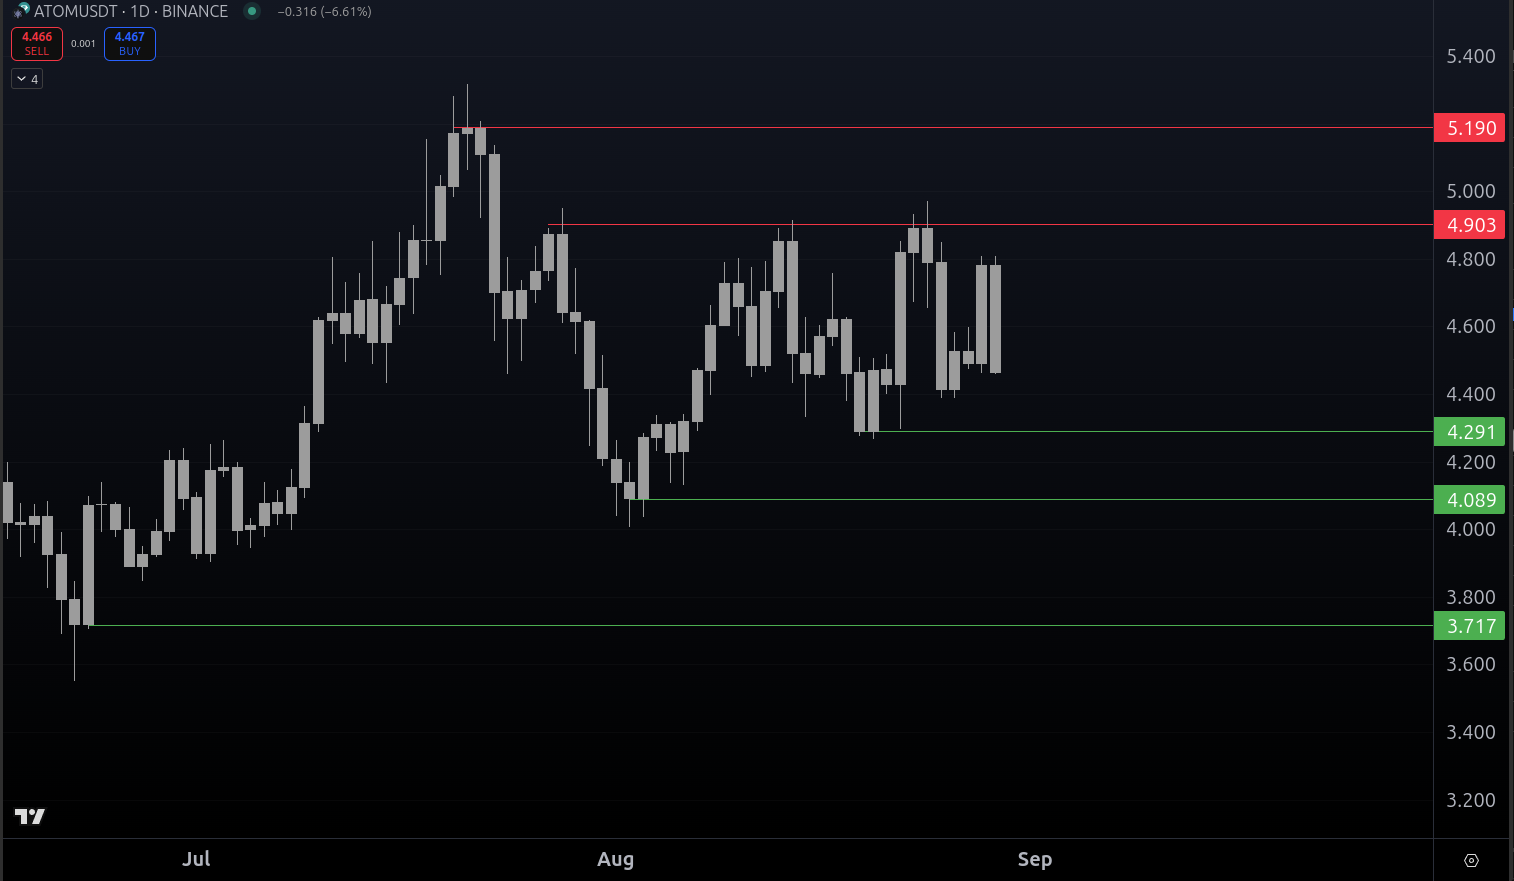
Every journey begins with a single step, and in TA, that step is learning to read price charts. Candlestick charts are the most popular. Each candle tells a story: where the price started, where it ended, and how far it traveled in between. Over time, you'll spot areas where prices tend to bounce (support) or stall (resistance). These zones are like invisible walls and floors in the market.
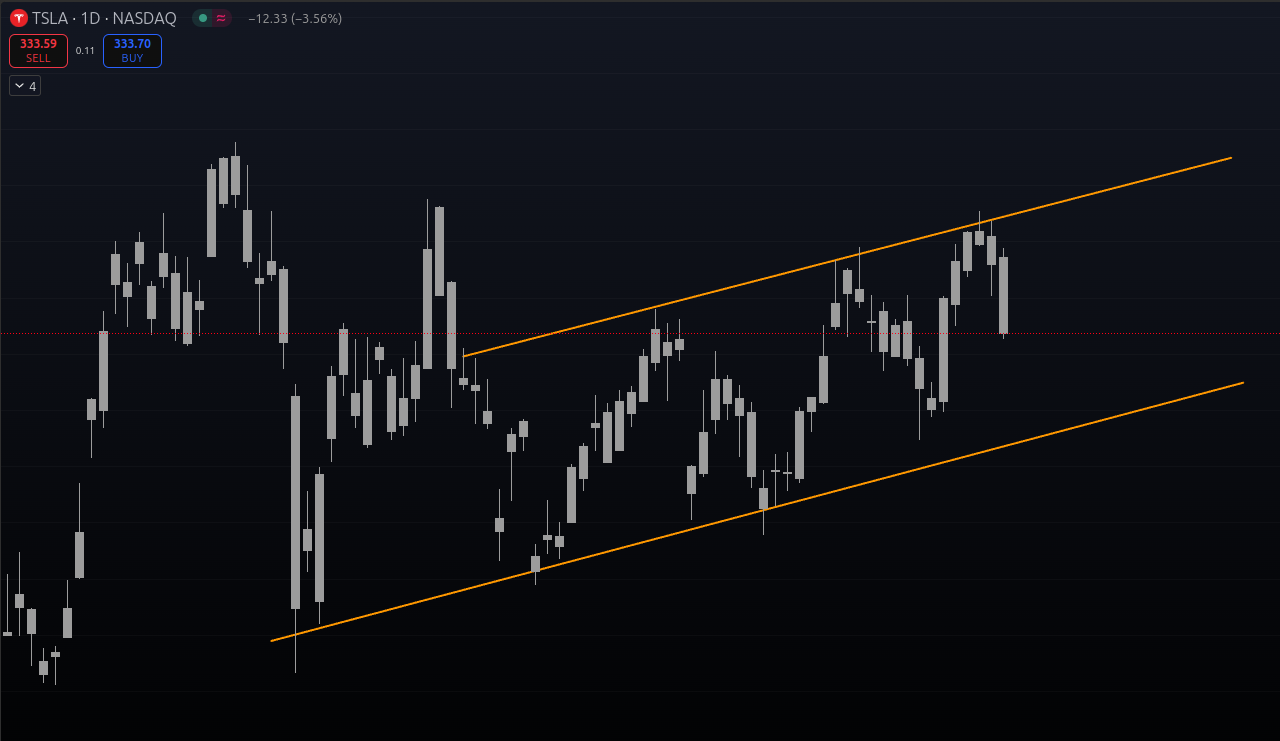
As you get comfortable, you'll notice trends—sometimes the market climbs steadily, sometimes it falls, and sometimes it just drifts sideways. Drawing trendlines and channels helps you visualize these movements, making it easier to spot opportunities and avoid traps.
Indicators: Your Market Sensors
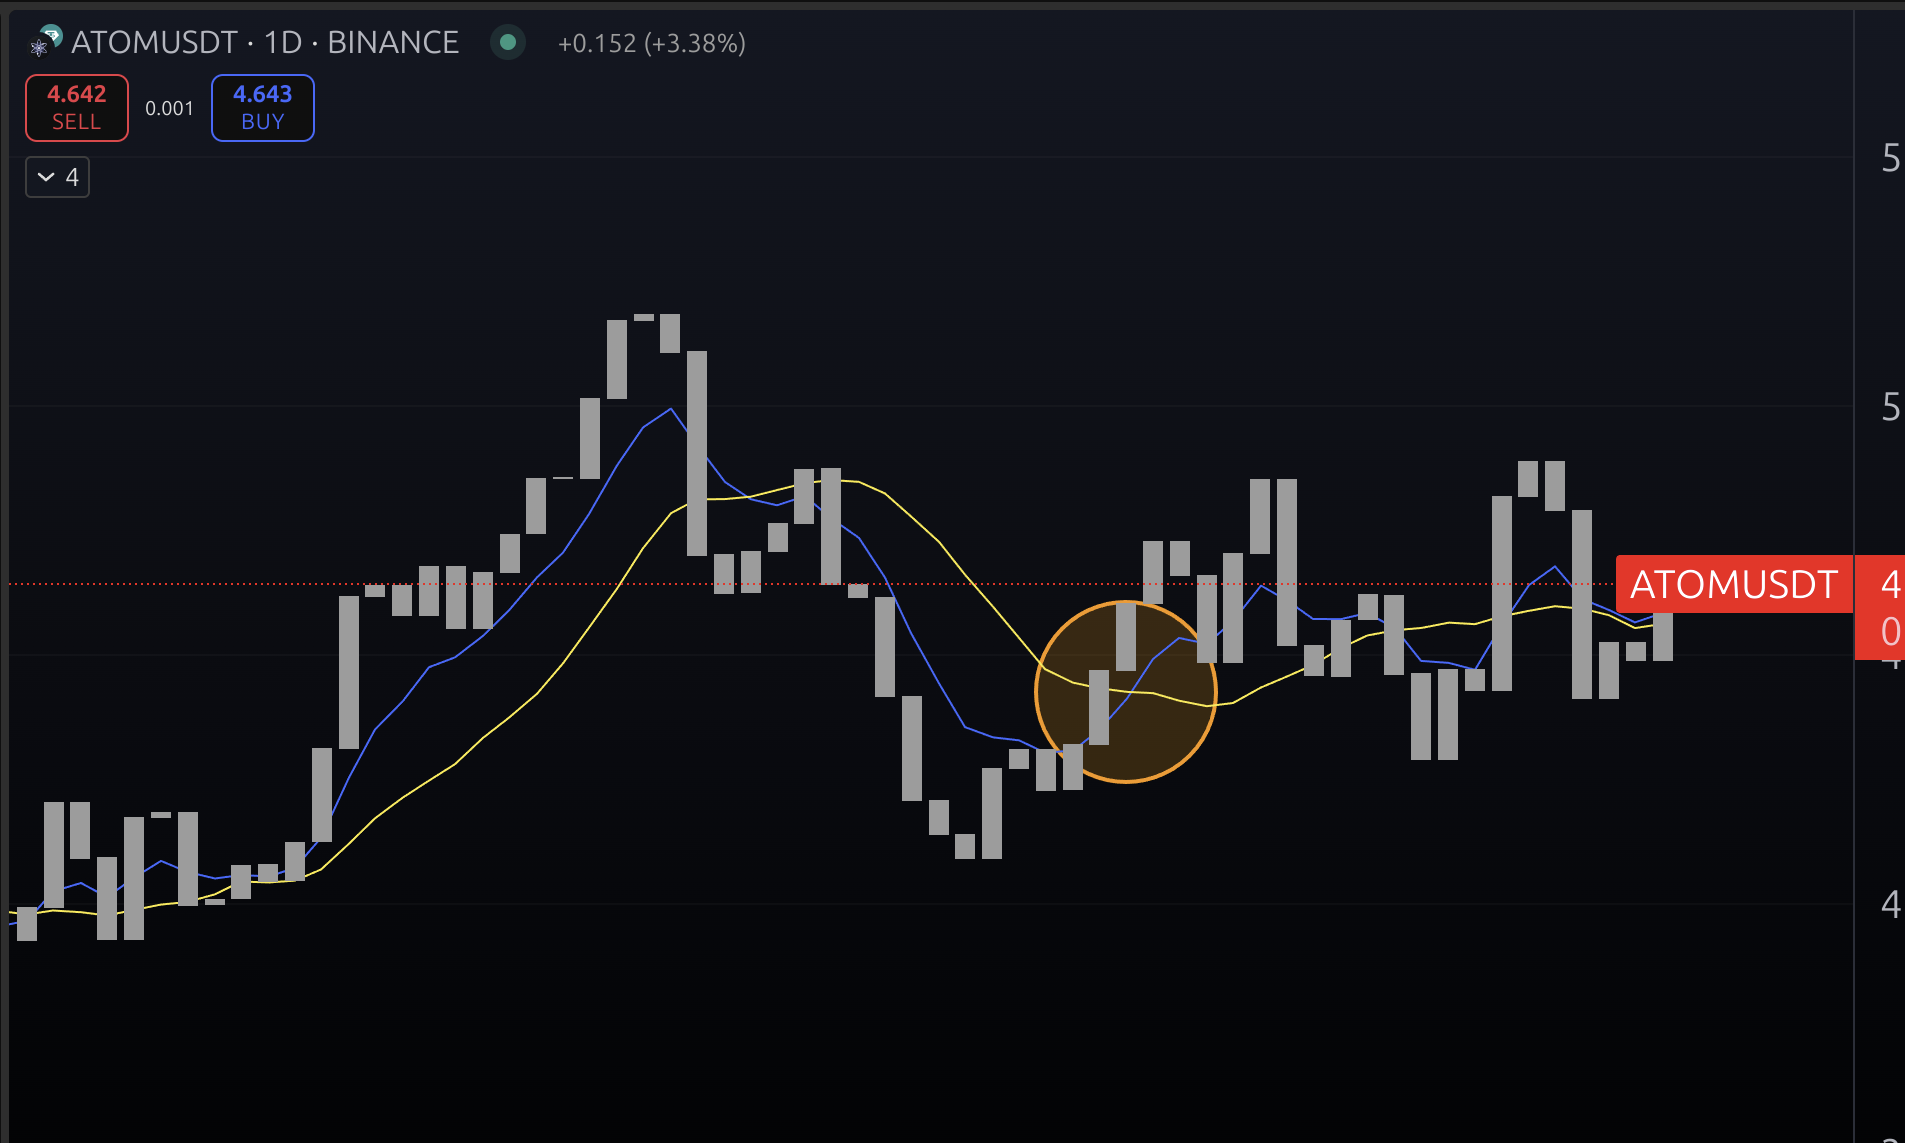
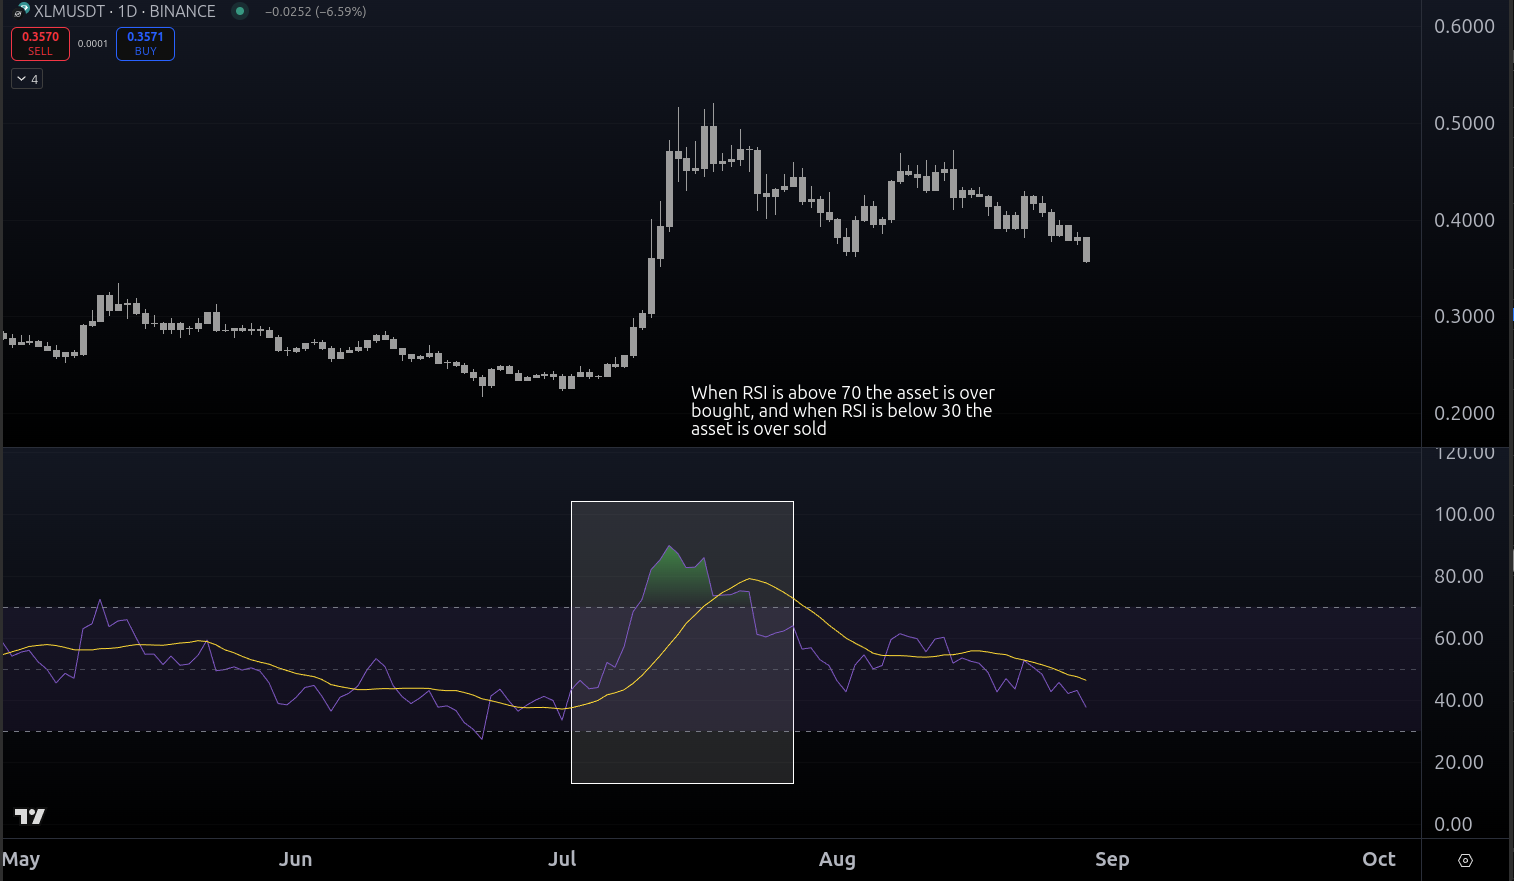
Indicators are like sensors on your ship, giving you extra information about the market's mood. Moving averages (MA and EMA) smooth out price data, helping you see the bigger picture. When a short-term average crosses above a long-term one, it can signal a new uptrend. The Relative Strength Index (RSI) tells you if an asset is overbought (maybe time to sell) or oversold (maybe time to buy). MACD and volume indicators add even more layers, showing momentum and the strength behind price moves.
Patterns: The Market's Secret Language
Markets love to repeat themselves. Chart patterns like triangles, head and shoulders, and double tops/bottoms are the market's way of whispering its intentions. For example, a head and shoulders pattern often signals a trend reversal, while flags and pennants suggest the trend will continue. Learning to spot these patterns is like learning to read the market's body language.
Putting It All Together
TA works best when you combine different tools. Don't rely on just one indicator or pattern—look for multiple signals that confirm each other. And always remember: risk management is your lifeboat. Use stop losses and position sizing to protect yourself from unexpected storms. Avoid the temptation to pile on too many indicators; sometimes, less is more.
Tools for Every Trader
You don't need expensive software to get started. Free platforms like TradingView, CoinMarketCap, and Binance offer powerful charting tools. As you grow, you might explore paid options like Altrady or CryptoQuant for advanced analytics. Whatever you choose, practice backtesting your strategies before risking real money.
The Trader's Mindset
Technical analysis is only as good as your discipline. Stick to your plan, even when emotions run high. Avoid FOMO (fear of missing out) and keep a trading journal to review your decisions. The best traders are lifelong learners, always refining their approach.
Conclusion
Technical analysis is your compass in the crypto wilderness. Start small, experiment, and keep learning. Join the ThinkSmart.Life community for deeper insights, coaching, and signals. And don't forget to subscribe to our newsletter for weekly charts and strategy tips. Your journey to trading success begins today!